View Statistics and Reports
The ARM provides a Statistics Graphs page and ARM-embedded statistics reports, allowing operators to debug, monitor and optimize their network and routing. Statistics charts provide you with a clear view of your network and routing performance, helping you better understand, analyze, debug and optimize network routing and resources usage.
|
➢
|
To use statistics graphs: |
|
■
|
Open the Statistics Graphs page (Statistics > Graphs). |
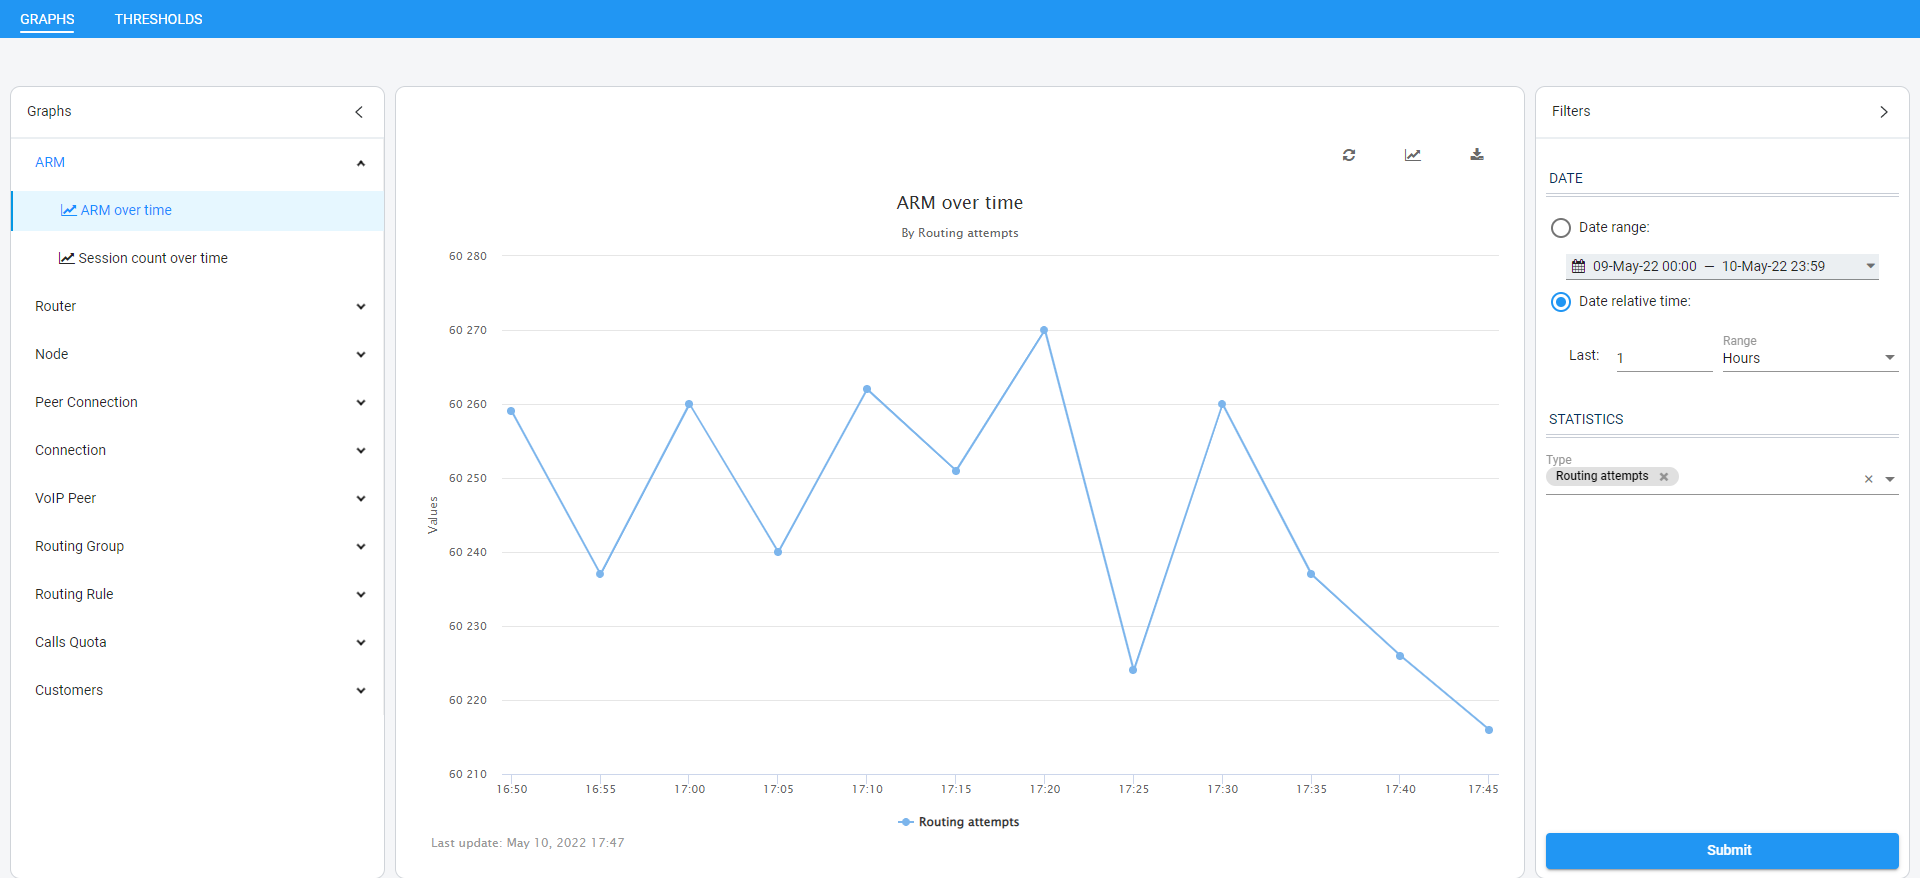
The page is divided into three sections.
Statistics Graphs Page (From Left to Right)
|
|
|
|
|
Statistics are displayed per element and are collected at an interval of every five minutes. Select either:
|
■
|
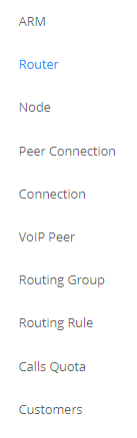
ARM (ARM over time, Session count over time) |
|
■
|
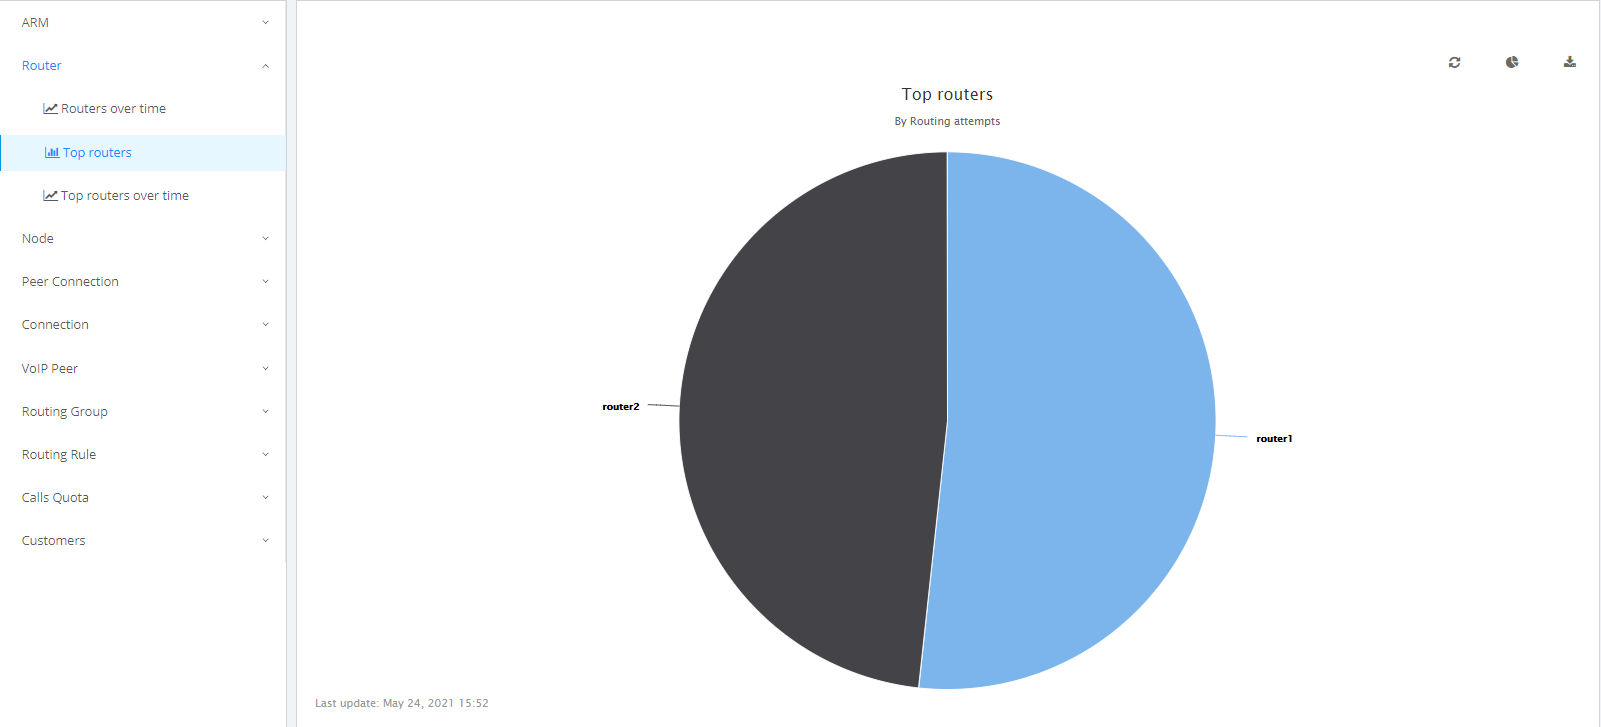
Router (Routers over time, Top routers, Top routers over time) |
|
■
|
Node (Nodes over time, Top nodes, Top nodes over time, Nodes by peer connections, Top nodes by peer connections) |
|
■
|
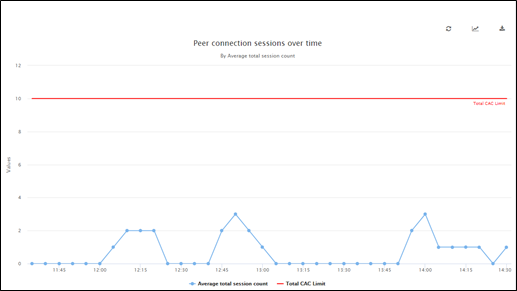
Peer Connection (Peer connections over time, Top peer connections, Top peer connections over time, Peer connection sessions over time)** |
|
■
|
Connection (Connections over time, Top connections, Top connections over time) |
|
■
|
VoIP Peer (VoIP Peer sessions over time) |
|
■
|
Routing Group (Routing groups over time, Top routing groups, Top routing groups over time, Top routing groups by rules, Top routing groups by rules) |
|
■
|
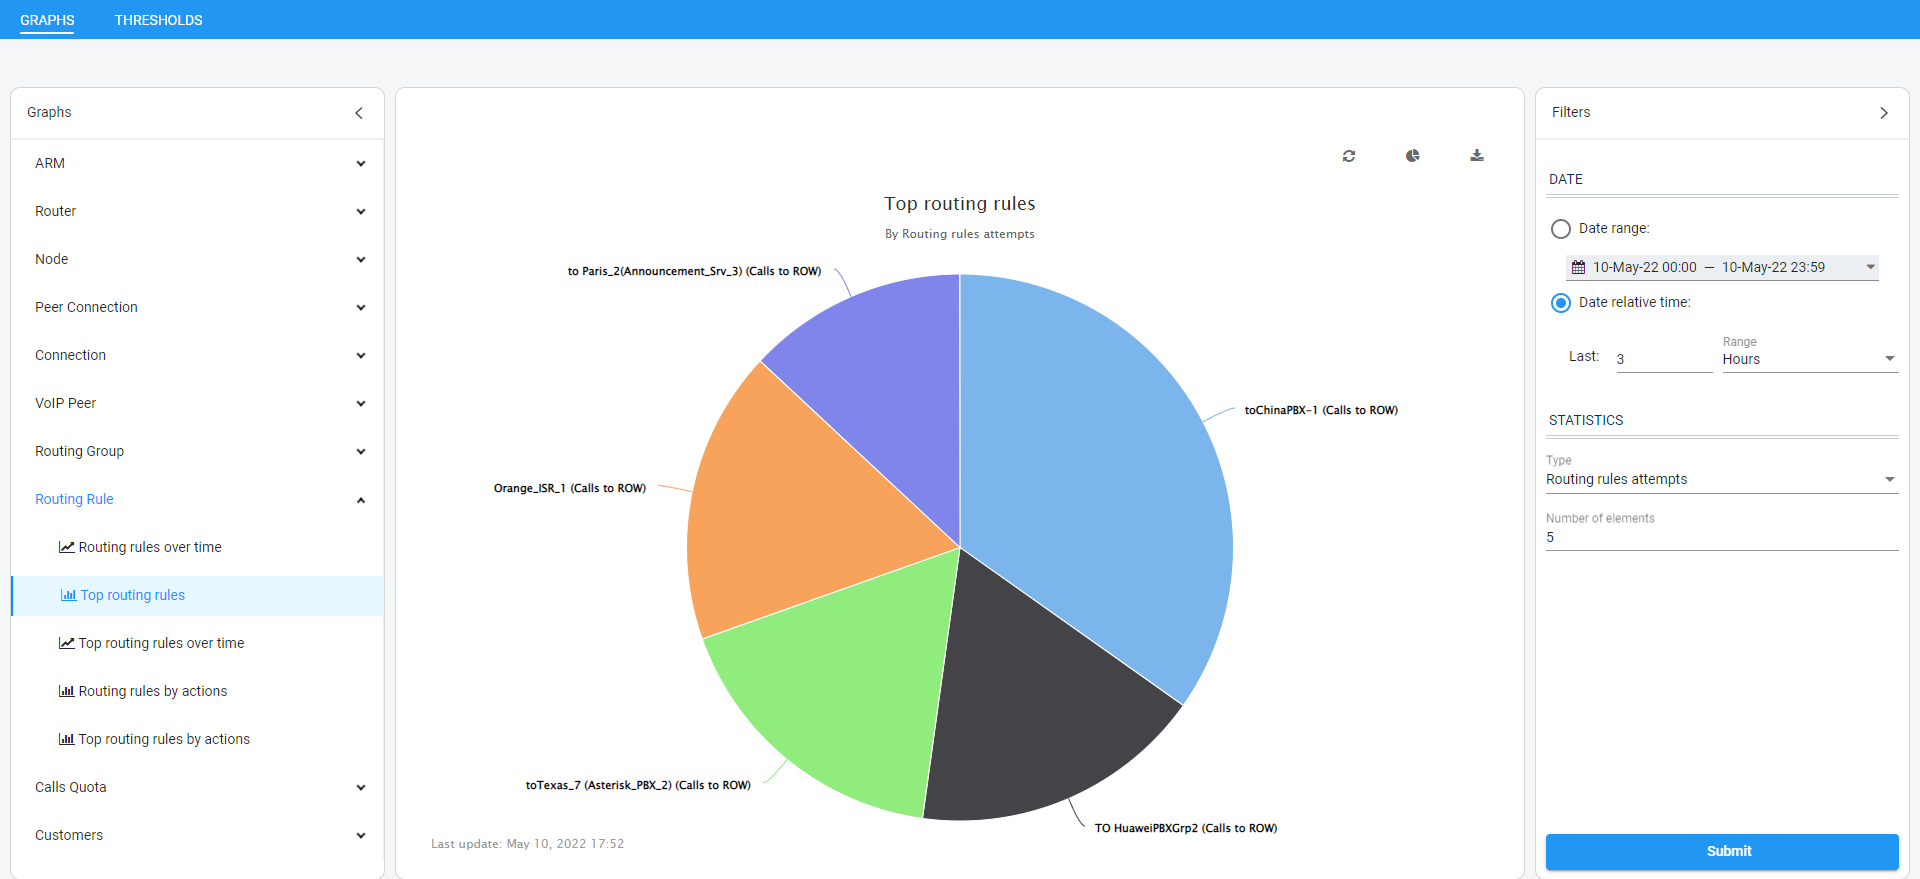
Routing Rule (Routing rules over time, Top routing rules, Top routing rules over time, Routing rules by actions, Top routing rules by actions) |
|
■
|
Calls Quota (Quota over time, Peer Connection over time, Resource group over time, Resource group by peer connection)*** |
|
■
|
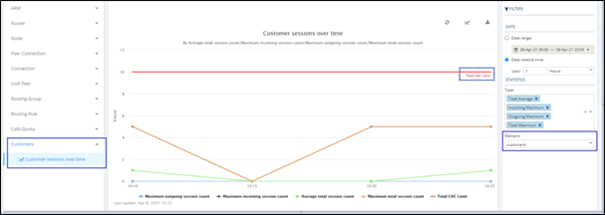
Customers (Customer sessions over time)**** |
|
Filters differ depending on the element selected. For all elements except Routing Group and Routing Rule, select from:
|
■
|
'Date' ('Range' or 'Relative') |
|
✔
|
Destinations Not Routable |
|
✔
|
Transient calls (does not apply to Peer Connection) (for Connection, only this filter applies) |
|
■
|
Statistics Type (only applies to Routing Group and Routing Rule) |
|
Graphic representation of the statistics of the selected element in a chart, with a range of graph functionalities:
|
■
|
Chart type (line, area or stacked area) |
|
* Here are explanations to help you better understand each 'Statistics Type' filter:
Routing attempt: Any initial routing request from the node is counted
Alternative attempts: Each triggered rule action that is not the first action of the rule
Unsuccessful routes: The call was dropped with some termination reason
Drop routing request: Discard action was triggered
Destination not Routable: If there was no rule matching ’Destination not Routable’ and 'Match rules are incremented'
Destination calls: Each time a call reached its destination
No match rules: No matching rule
Transient calls:
|
■
|
Per node: the call passed via the node and is not the first nor the last in the route chain |
|
■
|
Per connection: any call passed on a connection is counted as transient |
|
■
|
Per router: the sum of transient calls of all nodes |
|
■
|
Per ARM: the sum of transient calls of all routers |
Registration routed: REGISTER call was routed
Registration unrouted: REGISTER call was not routed
Registration blocked: REGISTER call was discarded
Average session count: The session count in a bucket of five minutes / 300 sec (average session count per second in a bucket of five minutes)
Total session count: The sum of incoming and outgoing session counts
** If you select the 'Peer Connection' tab and then 'Peer Connection sessions over time', you'll view the screen shown in the following example. Notice the Total CAC Limit which is only present if a CAC was attached to the element.
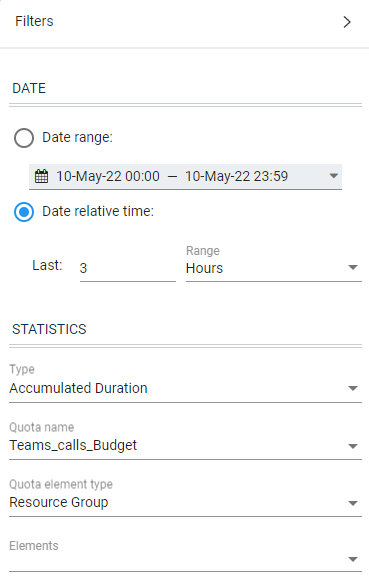
*** If you select the 'Calls Quota' tab and then 'Quota over time', the accumulated number of calls minutes for all Peer Connections or for Resource Groups associated with a specific quota will be displayed. Select a quota and then the Network Topology element type to be displayed (either Peer Connections or Resource Group); the ARM automatically filters relevant Network Topology elements (for example, a Peer Connection to which the quota is attached).
When submitted, the ARM will display minutes spent by each selected Network Topology element (for example, Peer Connections to which the calls quota was assigned). In the example below, a reset occurred because the period defined in the quota that was assigned to both Peer Connections, ended:
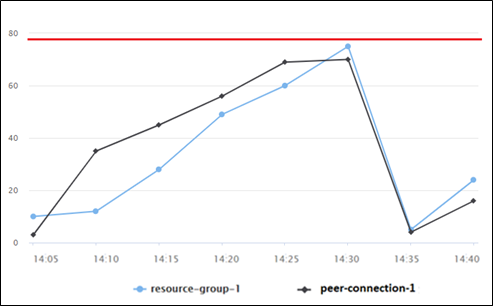
If a call starts before the quota is reached:
|
●
|
the ARM will not drop the call |
|
●
|
the call will be calculated |
In this case, the quota can be exceeded and it will be shown in the statistics.
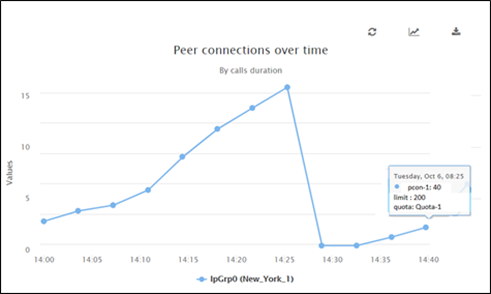
If you select the 'Quota' tab and then 'Peer connections over time', you can select a specific Peer Connection (or multiple Peer Connections – where each can have a different Quota) and view the calls time (minutes) over time. A tooltip displays for each graph the name of the quota associated with the Peer Connection and the minutes assigned.
If you select the 'Quota' tab and then 'Resource group over time', you can then select a specific Resource Group (or multiple Resource Groups where each can have a different quota) and view the calls time (in minutes) over a timeline per Resource Group (the accumulated value for all Peer Connections in the Resource Group).
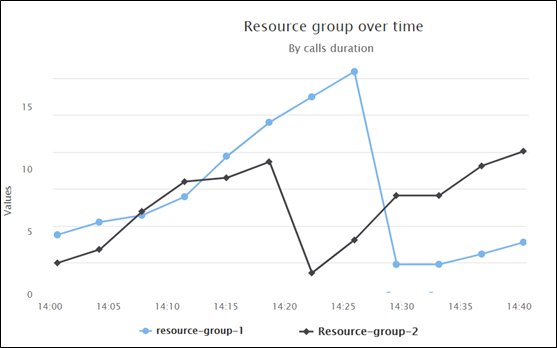
Only Resource Groups of type ‘Peer Connection’ can be selected. A tooltip displays for each graph the name of the quota associated with the Resource Group, and the limit (the number of minutes defined in the quota balance).
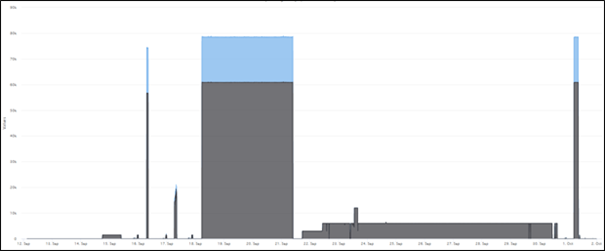
If you select the 'Quota' tab and then 'Resource group by peer connection', you'll view a stacked area (by default) showing consumption of calls minutes per Peer Connection in a specific Resource Group with an attached quota. You'll see, for example, that a quota allocated to a Resource Group connecting Teams is consumed unequally, mainly by one of the group’s Peer Connections.
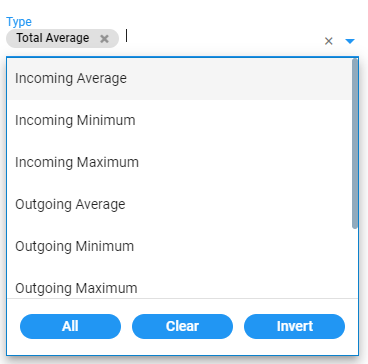
**** If you select the 'Customers' tab and then 'Customer sessions over time', you can then on the right side of the page select a specific ‘customer’ entity:
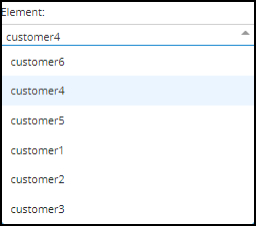
The following statistics 'Types' can be selected per ‘customer’ entity:
When showing statistics over time, the ARM also displays for your convenience the associated CAC Profile simultaneous sessions limit, thus allowing you to view the correlation and the number of sessions available for a ‘customer’ entity.
Top Routers filtered by Routing Attempts, displayed as a Pie Chart
|
■
|
A glance at the chart immediately reveals the top router. Point your cursor over a segment to display the number of routing attempts attempted by that router. |
|
■
|
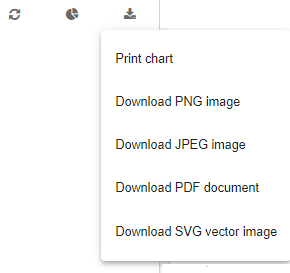
You can print the chart or download the statistics in a format of your choice. |
|
■
|
You can select your preferred graphical representation – bar chart, column chart or pie chart. An icon 'Select chart type' allows you to present statistics according to your preferred graphical representation. |
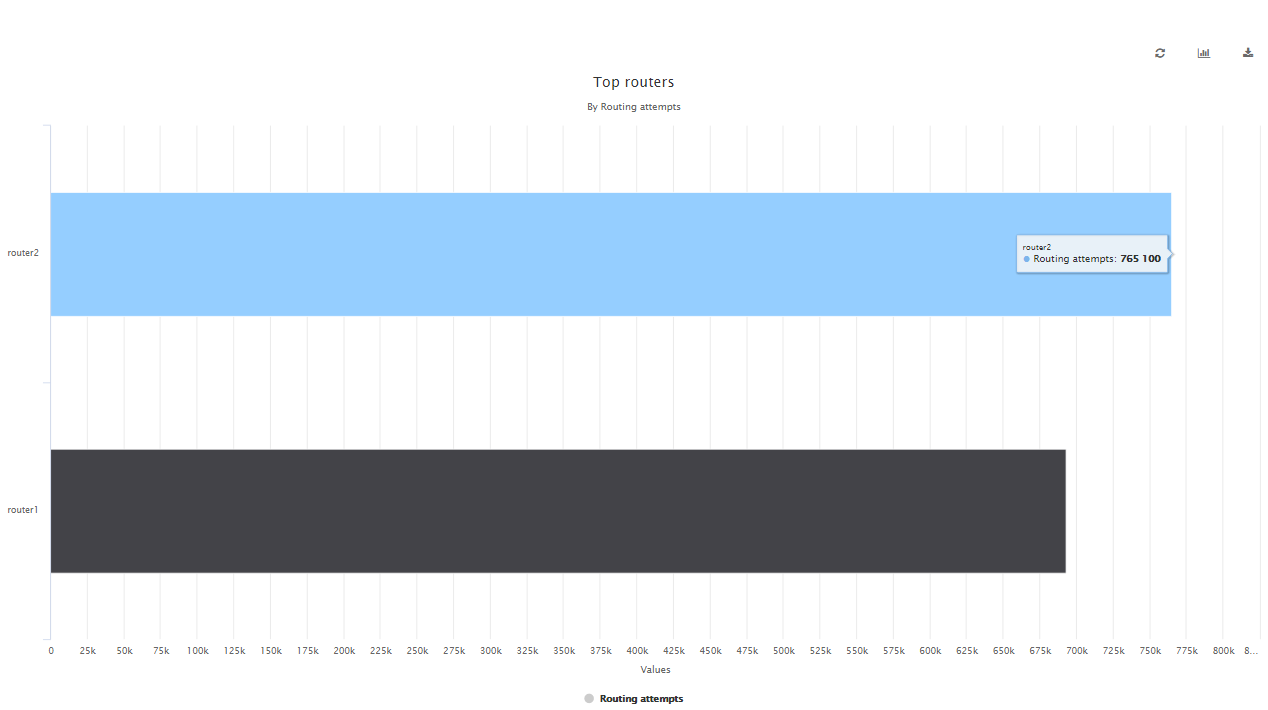
Top Routers filtered by Routing Attempts, displayed as a Bar Chart
|
■
|
A glance at this chart also immediately reveals the top router. Point the cursor over a bar to display the number of routing attempts attempted by that router. The following figure shows the elements that hold statistics information. |
Each element displays subcategories. Under Routing Rule, for example, you can select 'Top Routing rules’, 'Top Routing rules over time’ or ‘Top Routing rules by actions’.
In addition, in the Filters section of the page, you can select 'Number of elements'.
Statistics pages feature filters in which network administrators can select multiple elements
and then invert the selection. The feature improves usability and user experience especially
in large networks with high numbers of elements. The feature allows network administrators to
|
●
|
Select a single element
|
|
●
|
Delete a single element (x)
|
|
●
|
Clear all selected elements
|
|
●
|
Select All and delete a few (x)
|
|
●
|
Select All, delete a few (x) and then invert the selection; the elements deleted will be
in the selection
|
|
●
|
Select a few elements and then invert the selection; only elements that weren’t
selected will be in the selection
|